Dealing with more complex signals
Wavelet analysis is all about the rhythms which properties, like amplitude and frequency change with time. One of the most vivid examples is a chirp signal, I picked the chirp of the following fasion:
y = sin(2*pi*0.5*time**1.5)
(time**1.5 means time to the power of 1.5).
Then we load the signal, adjust the wavelet transform parameters a little and compute the cwt to obtain the following:
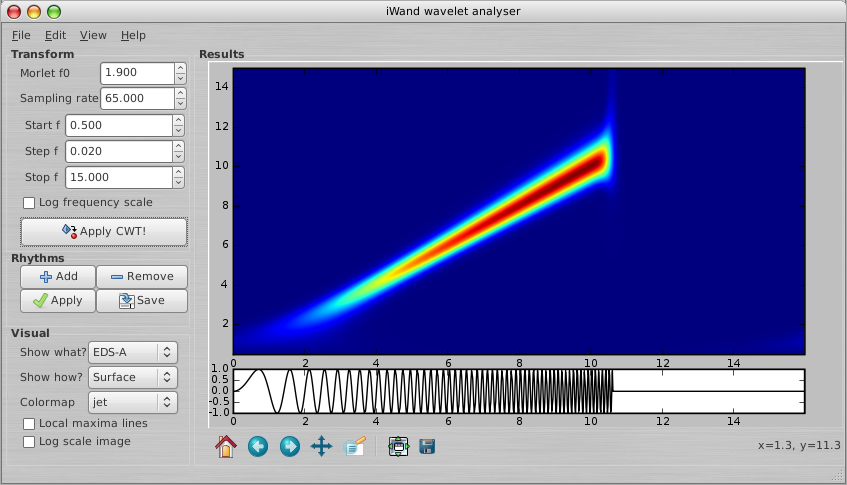
We see that that frequency associated with the rhythm rises with time.
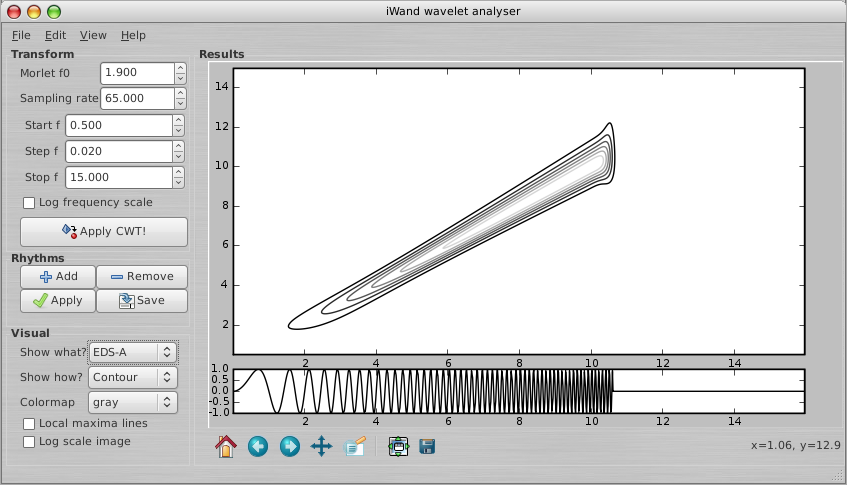
The results can be also viewed as a contour map. To do so, select 'Contour' in the 'Show how?' combo-box:
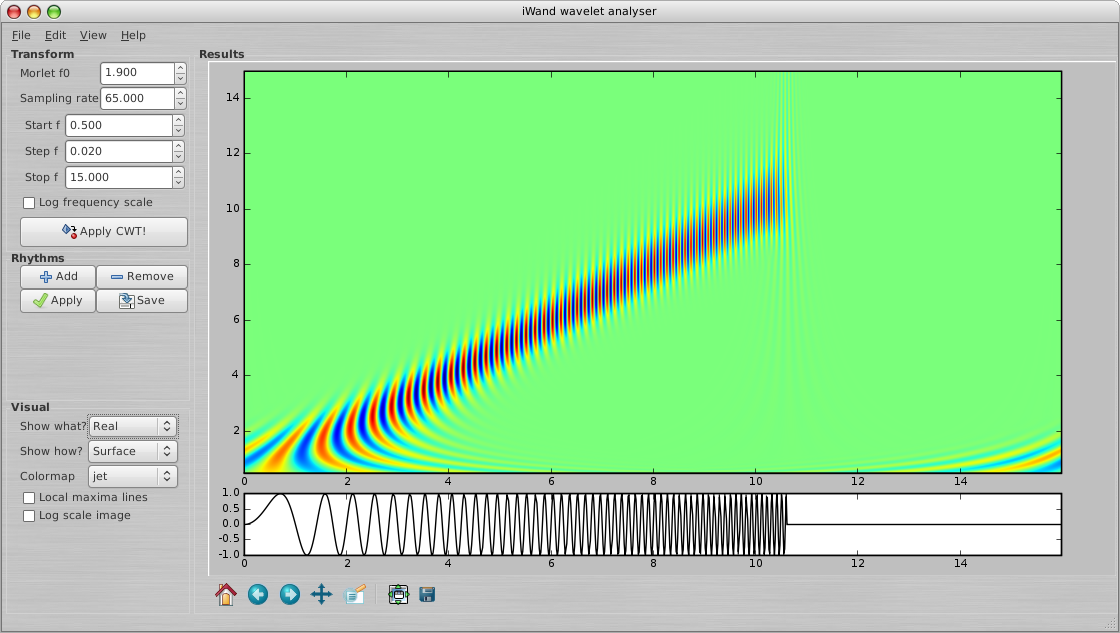
Apart from the energy, we can also take a look at the real or imaginary components of the wavelet transform coefficients. To do so, select 'Real' or 'Imaginary' in the 'Show what?' combo-box. For instance, real part:
It is also possible to visualize the phase of the signal, but it is quite complicated to analyse.